1. Executive Summary
This document is the manual (user guide) of the Let’s Coordinate tool developed for RSC services that RSCs provide to TSOs, in order to present the main screens, functionalities of the tool and describe how to use the tool.
With this tool, user will be able to receive notifications to warn about relevant information linked to business processes (quality check report, results of calculation, free message…), to receive notifications to coordinate between TSOs and RSCs with dedicated screen to monitor and have a correct traceability of this coordination and to consult and export RSC KPI reports for these RSC processes.
2. Introduction
2.1. User types
For the Let’s Coordinate application, we have 3 user types:
-
Transmission System Operator (TSO),
-
Regional Security Coordinator (RSC),
-
Administrator (ADMIN).
Let see details about each of them:
2.1.1. TSO user
Each TSO is able to define a list of users among its entity to access to the tool within Keycloak authentication tool. Each TSO has the possibility to interact with dedicated notifications only for its entity as TSO. Each TSO authorized user is able to login to the tool, acknowledge notifications for its TSO for authorized RSC services, to answer to coordination requests and to monitor them, to consult KPIs for RSC processes and generate RSC KPI report.
2.1.2. RSC user
Each RSC is able to define a list of users among its entity to access to the tool within Keycloak tool. Each RSC has the possibility to interact with notifications for its entity as RSC and all received notifications related to one of the TSOs under its responsibility (without impacting the TSO notification itself). Each RSC authorized user is able to login to the tool, acknowledge notifications for its RSC for authorized RSC services, to follow coordination requests from their TSOs and to monitor them, to consult KPIs for RSC processes and generate RSC KPI report.
2.1.3. Administrator user
In general, administrator (ADMIN) user has specific rights and can’t access to TSOs or RSCs data. Some operations are restricted to users with the ADMIN role, either because they are administration operations with a potential impact to OperatorFabric or Let’s Coordinate instances as a whole, or because they give access to information that should be private to a user.
Below is a quick recap of these restricted operations:
-
Users Service
-
Any action (read, create/update or delete) regarding a single user’s data (their personal info such as their first and last name, as well as their settings) can be performed either by the user in question or by a user with the ADMIN role.
-
Any action on a list of users or on the groups (if authorization is managed in OperatorFabric) can only be performed by a user with the ADMIN role.
-
-
Thirds Service
-
Any write (create, update or delete) action on bundles can only be performed by a user with the ADMIN role. As such, administrators are responsible for the quality and securi-ty of the provided bundles. In particular, as it is possible to use scripts in templates, they should perform a security check to make sure that there is no XSS risk.
-
| The ADMIN role doesn’t grant any special privileges when it comes to card consultation (be they current or archived), so an user with the ADMIN role will only see cards that have been addressed to them or to one of their groups), just like any other user. |
2.2. Supported browsers
The tool is supporting the 3 most recent versions of these 3 following web browsers:
-
Google Chrome,
-
Mozilla Firefox,
-
Microsoft Edge.
3. System login and logout
3.1. System login
When Let’s Coordinate has been installed on a specific server, to connect/log in to the Let’s Coordinate tool, user will have to use the Let’s Coordinate direct url to open directly the Let’s Coordinate tool: http://localhost/ui/.
After connecting to url address, user should enter its credentials:
-
Login: username or email
-
Password
Then validate with “Log In” button.
After login, user will be redirected to the “Feed screen” of Let’s Coordinate which is the Home screen of the tool.

The name (last and first names) and the entity (name of TSO or RCC) will be displayed on the right part of the header.
3.2. System logout
To log out, user can disconnect with a specific button on the top right part of the header of the screen. With the little triangle button on the right of username, user can click on it to display the content and then select log out.

After log out, user will come back to login page.
4. Screens presentation
4.1. General screen overview
The proposed GUI for the application is common for all screens in the application.

-
On the top of the page, you have a header with
-
Menu to access to the different screens of the tool.
-
Card Feed screen: to receive and display the different notifications. User will have the possibilities to manage the notifications in this screen.
-
Archiving screen: to access to all existing notifications which are stored in the database
-
Monitoring screen: to monitor the status of the coordination
-
Logging screen: to displays logs of the relevant information about the coordination process
-
RSC KPI report screen: to configure and present the relevant Key Performances Indicators (KPIs) of the RSC services (graphs and report)
-
Card creation link
 : to create from the GUI a notification and to send it to different users (TSO and/or RSC) or group of users
-
-
Login information menu:
-
In the top right of the page, you have the name & company of logged user
-
Below to the name of the logged user, current time for selected time zone of the day is displayed.
-
-
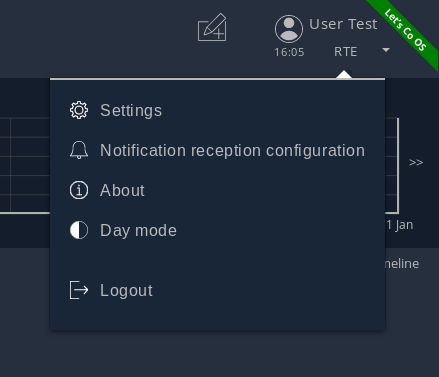
User settings menu
-
Settings screen: to present the different settings for the user to be set (time zone, notification arrival with sounds…)
-
Notification reception configuration screen: to select which notifications to receive or not in the feed screen
-
About: to present the deployed version of the application
-
Day mode: to change from day to night modes or night to day modes
-
Log out: to log out from the application
-
-
-
A banner at the top right of the top menu indicates on which environment Let’s Coordinate is installed or to give a specific name to this version of Let’s Coordinate (optional)
-
Below the header, you have the content of the screen
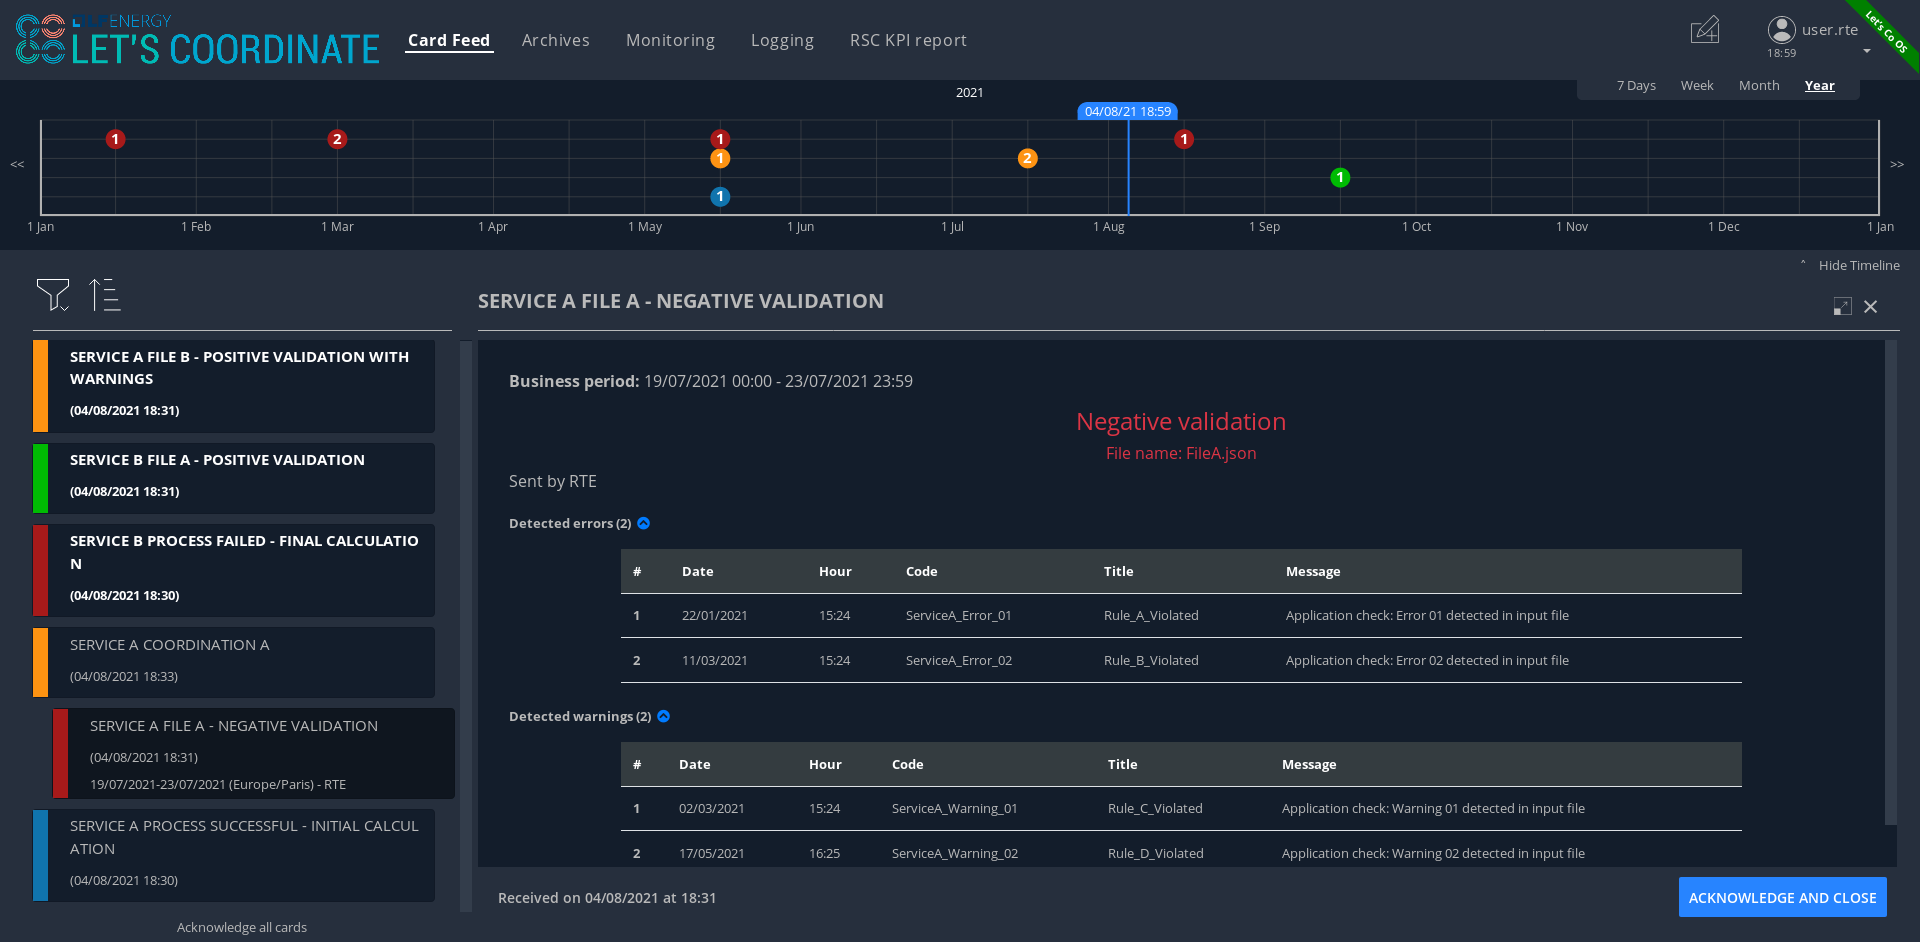
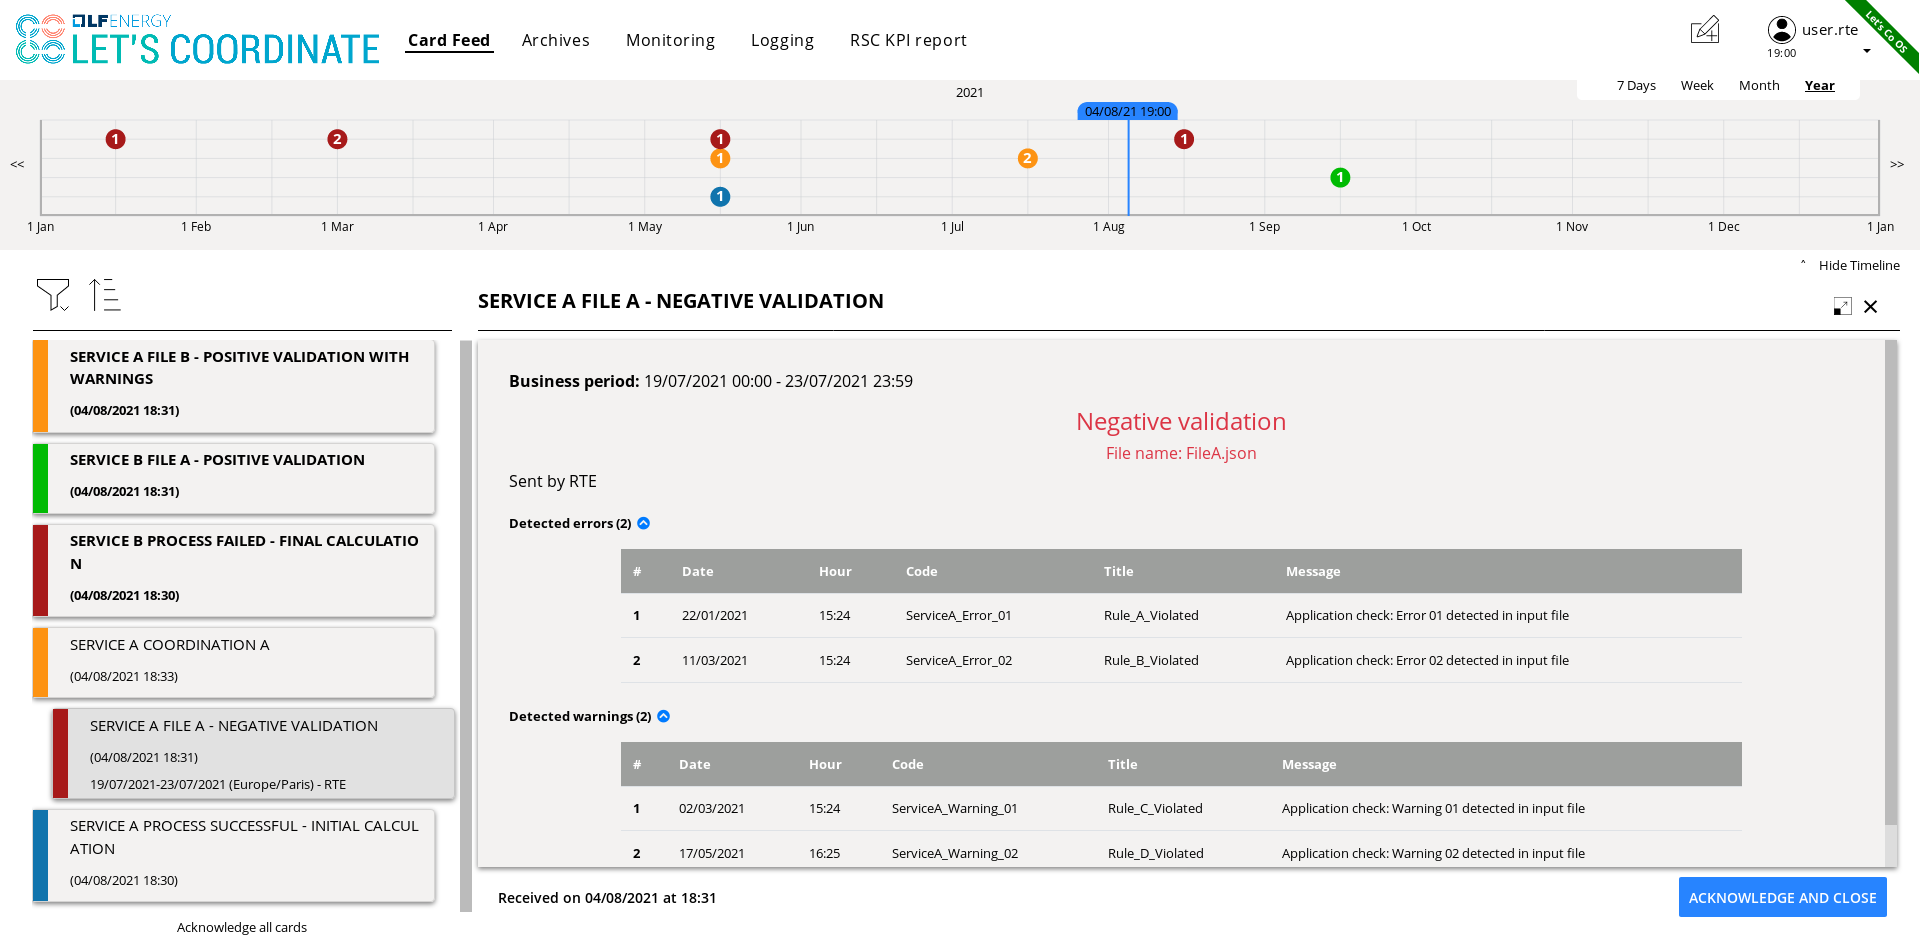
4.2. Card Feed screen
The card feed screen is the place to receive and manage cards/notifications.
On this screen,
-
Below the header, you have a timeline which presents when the events displayed in the notification are relevant.
-
On the left of the page, you have the deck of notifications which presents all received notifications.
-
On the right of the page, you have the detailed information of the notification.
4.2.1. Notification feed/deck consideration
Global concept
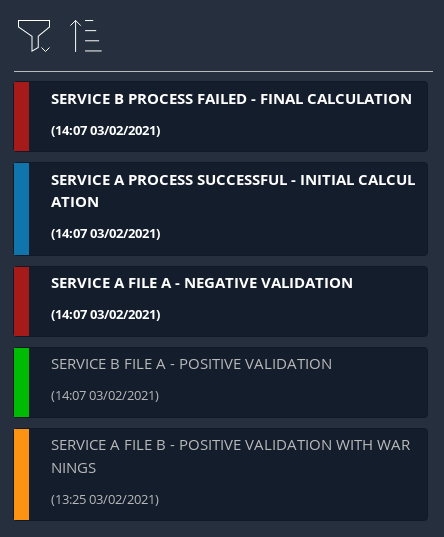
On the left part of feed screen, a deck presents all received notifications.
Notification concepts
Notification is an object which can support different operational information relevant for business process. Each notification has a "reduced view" to present a summary of its content, and a detailed view to see more about the notification.
There are 2 kinds of notifications which depends on the event to raise:
-
INFO: for an informative notification, user can just acknowledge it.
-
ACTION: for an action/smart notification when user should act (accept, reject, explanation about rejection and comment).
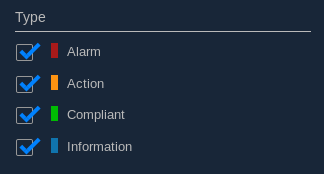
The color of the notification depends on the status of the card:
-
INFO – blue: Information is received (like results of calculation are available)
-
COMPLIANT – green: Validation has been performed successfully (like ACK is positive)
-
ACTION required - orange – Warning: Please consider this notification and act to manage the raised situation/issue
-
ALARM – red – Critical issues (like Process failed, validation failed)
They are 2 kinds of information inside an informative notification:
-
General information: notification with a general information along the business period
-
In such notification, a global information is applied for all business period without any specific timestamp identified
-
Ex: Process success, process failed, input file positive validation…
-
-
Specific timestamped information: notification with information for specific timestamps inside the business period
-
In such notification, different information for dedicated timestamps are identified. Ex:
-
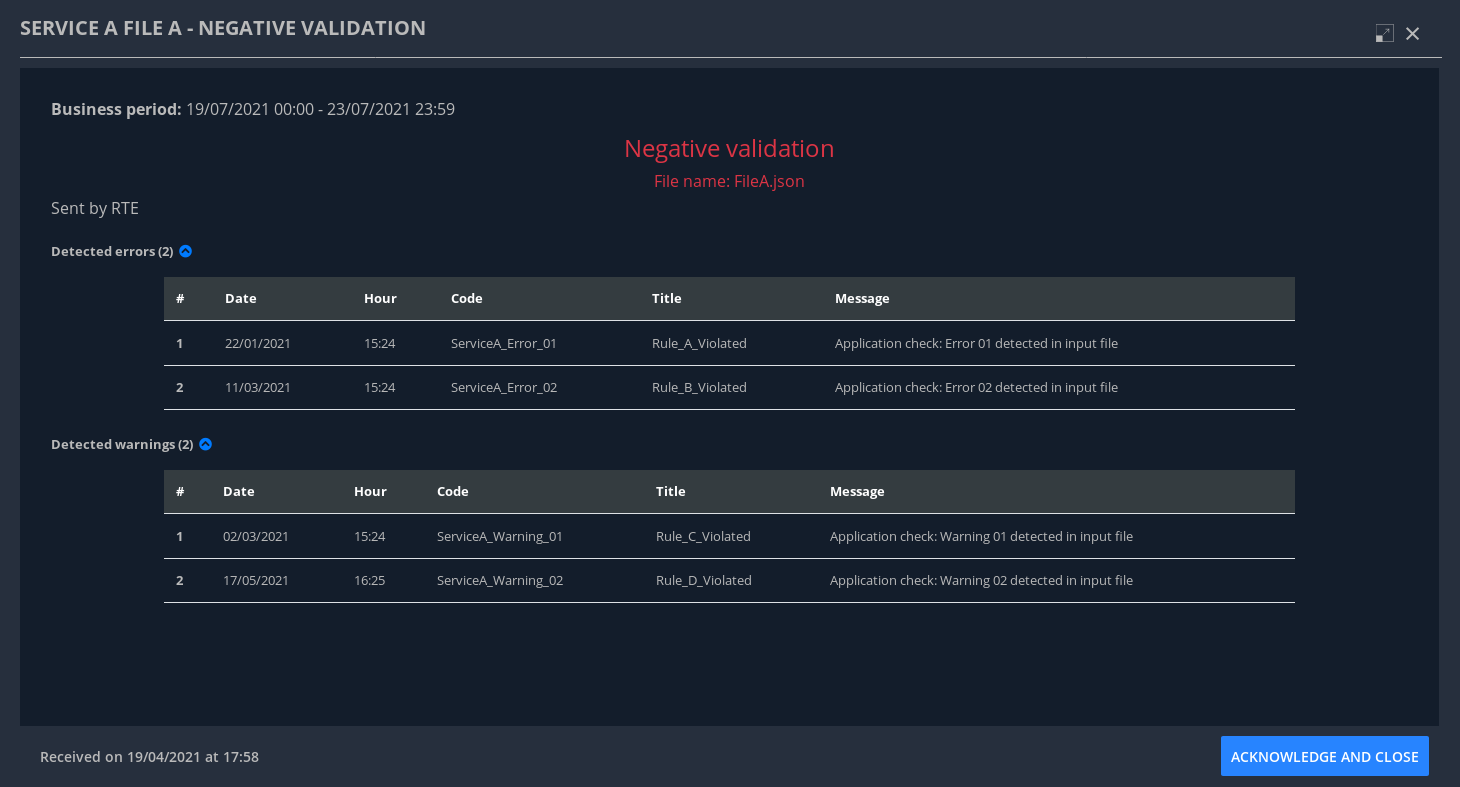
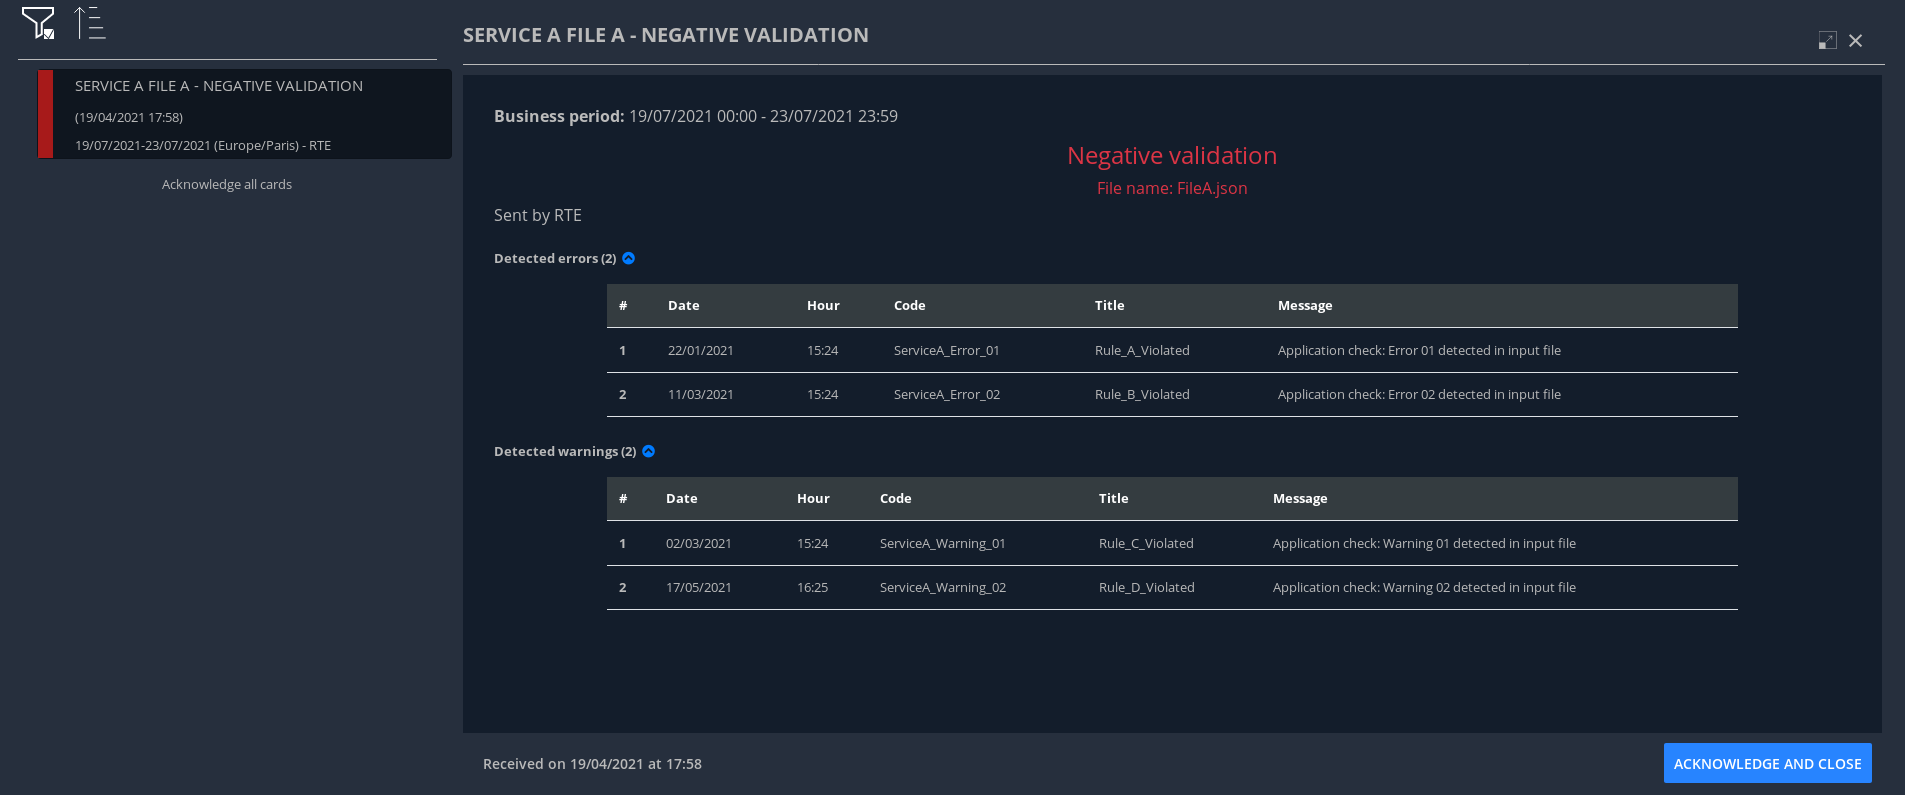
Input file Negative validation ⇒ all severe errors, errors and/or warnings are detailed per timestamp
-
Input file Positive validation with warnings ⇒ All warnings are detailed per timestamp
-
-
Arrival date and business period
Each notification has an arrival date and a business period:
-
Arrival date to know when this notification arrived in the system
-
Example of arrival date: 19/09 13h23
-
-
Business period or validity period: from when to when this information is relevant from business point of view.
-
Ex: If a process result notification arrives the 19/09 at 13h23 and concerns the Month ahead process (so for October),
-
Example of business period: 01/10 0h30 → 31/10 23h30 included
-
Notification View
There are 2 views for a notification:
-
Reduced view in the deck of notification
-
Summary of the notification with limited information
-
Depending if the card has been read or not, an eye cross out symbol appears on the right part of the notification
-
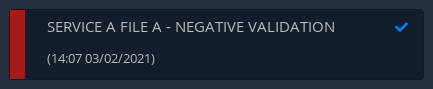
Depending if the card has been acknowledged or not, a ticked symbol appears on the right part of the notification
-
-
Detailed view in the right part of the screen
-
Presentation of the content of notification with detailed information
-
In the detailed view, you can have different buttons to act on this notification.
-
In case of informative notification, you will be able to acknowledge/cancel acknowledgment of a notification:
In case of Smart notification, you will be able to answer to some questions and then send your answers to the coordination system.

Read/Unread notifications
A new notification when arriving in the deck is always an unread notification. User can recognize it by the bold weight of the reduced view content:
If a user clicks on the notification for the first time, then the notification will be changed to read status and the bold weight will disappear.
Notifications arrival with sound
User have the possibility to activate (or not) a dedicated sound bell when a new notification arrives. Each color/severity of notification has a different sound and an user can decide to active the sound for its arrival by ticking the corresponding check box:

Deck display
On the left part of feed screen, a deck presents all received notifications based on their business period displayed in the timeline. Displayed notifications in the deck are the ones who are valid/active referring to the dedicated timeline view meaning: if at least one minute from business period (from businessDayFrom to businessDayTo) of the notification is in-cluded in the period presented in timeline view. Some buttons are displayed on top of the deck to perform some ordering or filtering:

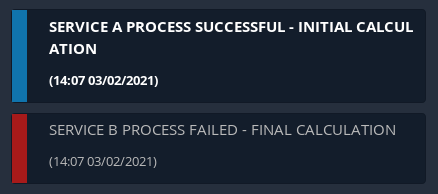
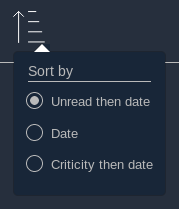
Deck ordering
Notifications in the deck are sorted by default by "Unread then date" order. User can decide to order the notifications in the feed by arrival date or by severity/color:
Deck filtering
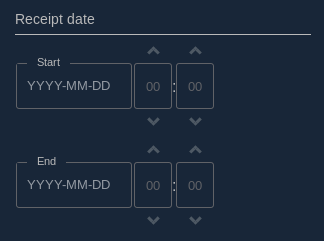
Some filters are proposed to filter the deck of card:
-
Between 2 arrival dates
-
Based on the type/color of the notifications
-
User can ticked or un-ticked notification color he wants to see:
-
-
Status of the notifications: Acknowledged/Not acknowledged with the following menu. User can select to see:
-
all notifications (acknowledged and not acknowledged)
-
only acknowledged notifications
-
only not acknowledged notifications
-
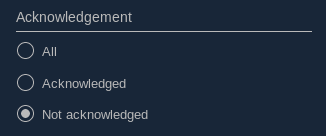
By default, only “Not acknowledged” notifications are displayed: As soon as a user will acknowledge a notification, it will disappear from the deck based on this filter.
4.2.2. Timeline consideration
Global concept
Below the header, a timeline is proposed. This timeline represents a spatial view of information inside the notification depending on its severity/color, the event arrival or occurrence/relevancy.
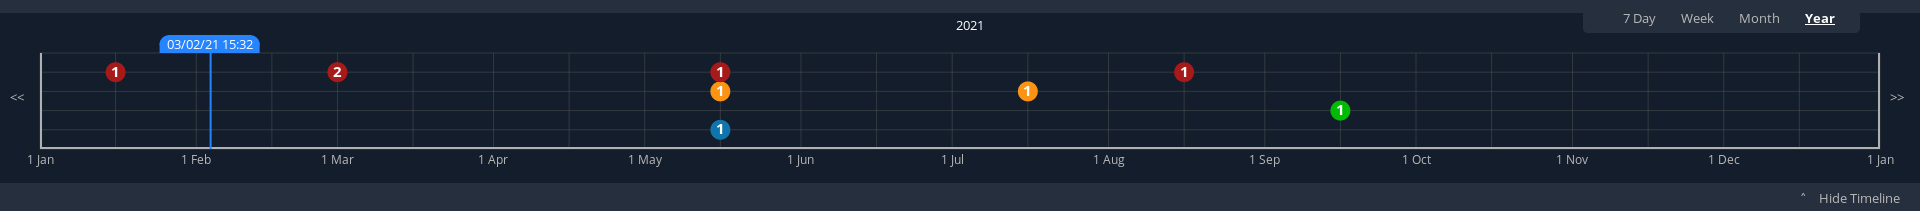
Different views
To ease the view and to match with relevant timeframe processes, 4 different zooms are proposed:
-
7 Days view from D-1 0h selected time until D-7 selected time – Default view
-
Week view from Saturday 0h selected time until next Saturday 0h selected time
-
Month view from 1st of the month 0h selected time until 1st of next month 0h selected time.
-
Year view from 1st January 0h selected time until 1st January of next year 0h select time.
-
>> : to move to the next period
-
<< : to move to the previous period
A specific button on the bottom right is dedicated to hide (or not) the timeline:

When timeline is hidden, the considered business period (before it was hidden) is displayed on the left of its buttons.
For all first-time period view selection, the selected period will be preceded by the remaining days and hours between real time (current time) and begin of selected period (operational view).
User can click on >> button to see the next period or click on << button to see the previous period. In case user was in the first-time period view selection, if user clicks on << or >>, then the timeline will be configured in study mode view: beginning and end of the period displayed in the timeline are referring to selected period (without representing real time if not inside the period).
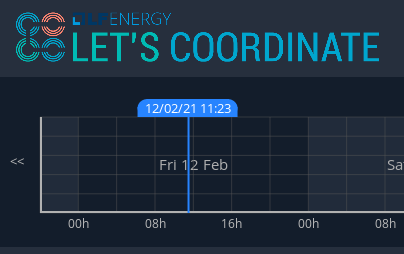
Time tick consideration
Each time tick represents a specific date and hour. The information displayed in this tick is the information from this time tick and before the next one.
For example, if the time tick is for the 11/10 0h with 7D view (a time tick every 4h in that zoom), user will see aggregated values from 00h to 3h59. And for the time tick of 11/10 4h, information from 4h to 7h59 etc…
“Real-time” time tick displays current hour and day. It’s marked as a bold blue time tick in the timeline if it is included in the timeline view/zoom. Before real-time time tick, some days or hours are displayed in order to present some events which just passed now in the past.
Bubble tips in the timeline
Bubble tips are used in the timeline to present the number of notifications detected for the dedicated time tick per categories of notification (blue, red, green or orange).
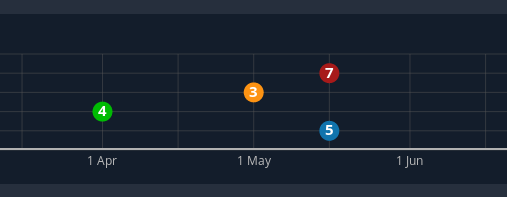
Ex: Here 7 red notifications have been detected, 3 orange ones… for the period between the 1st of April and the 1st of June.
The way to spatialize a notification in the timeline depends on kind of notifications.
-
In case of general information notification (notification with a general information along the business period), this information will appear as a bubble in the timeline at the arrival date
-
This information will appear in the timeline at the exact time/date when the notification arrived – when the global process/quality check has been done
-
Ex: if a process success notification arrived at 9h53 24/06, then the bubble will be at this time/date.
-
-
In case of timestamped information notification (notification with information for specific timestamps inside the business period), each information for dedicated timestamp will appear with a dedicated bubble in the timeline.
-
Each event (error, warning…) inside the notification will be presented with a dedicated bubble in the timeline
-
Ex: if inside a negative input file validation notification, error A is detected the 25/06 12h and error B is detected the 26/06 18h, then 2 bubbles are represented: one for the error A and one for the error B at dedicated date/time.
-
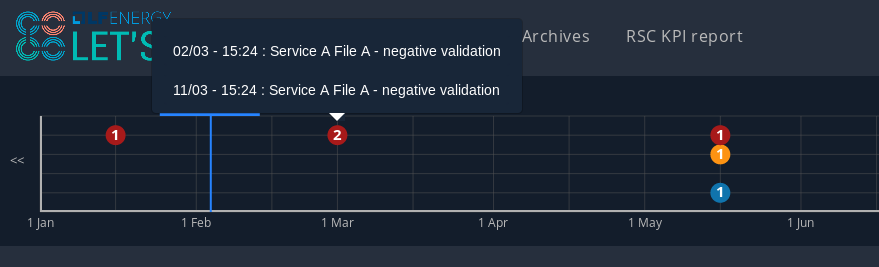
Visualization of content of bubble
User can click on a bubble to see the details of events inside the bubble. A window will appear and present all summary of notifications considered in this bubble. If user selects one of the presented items, then the dedicated notification will be opened as a notification detailed view from feed screen.
Link between timeline view and notifications in the deck
The timeline view affects the notifications in the deck as a kind of filter of them:
-
Each notification in the deck has a business period (businessDayFrom – businessDayTo).
-
If the business period of notification is included in the timeline period (timeline from – timeline to), then the notification will appear in the deck.
-
It can happen that a notification is not represented in the timeline as its arrival date/hour is not included in timeline view but as its business period is still included in the timeline period/view, the notification stays in the deck of notifications.
-
-
If the business period of notification isn’t anymore included in the timeline period/view, then the notification will be moved to archiving system.
Logged username, current time and user settings
In the right part of the header the following information is presented: the name (first and last name) of logged user, its company and the current time for selected time zone: With the little triangle button, user can click on it in order to open the "User settings" panel. In this menu, different screens are proposed to display the settings of this user the "notification reception configuration" panel, information about the application version, to change the day/night mode or to logout.
-
Settings at user level screen
In this screen, user can decide to change its time zone based on a proposed list of European cities: all hours in the tool will be updated referring to this time zone.

-
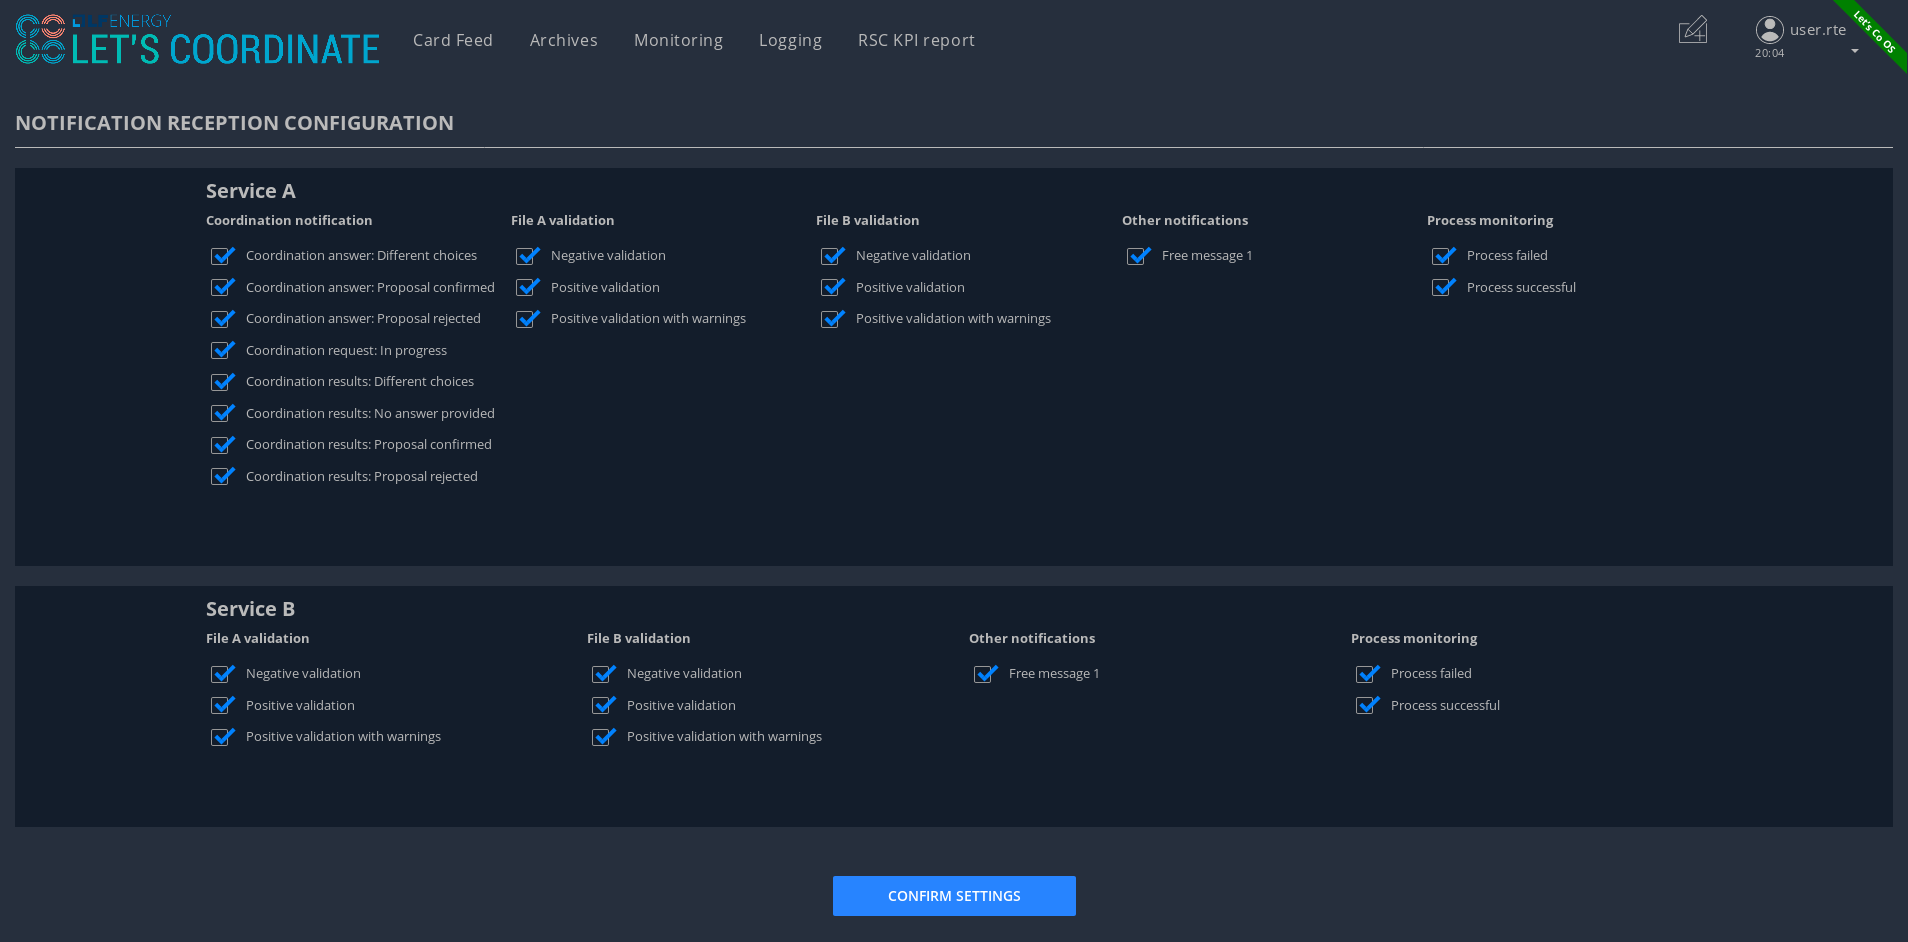
Notification reception configuration screen
This screen displays a panel to select which notification user wants to see and receive or not.
-
About screen
When selecting “About”, versions of deployed tools are displayed.

-
Day/night mode
This functionality is used to change the color of the background of the tool by using a dedicated menu item:
-
Day mode menu item to switch background to day mode with light colors

-
Night mode menu item to switch background to night mode with dark colors
Example for the feed screen:
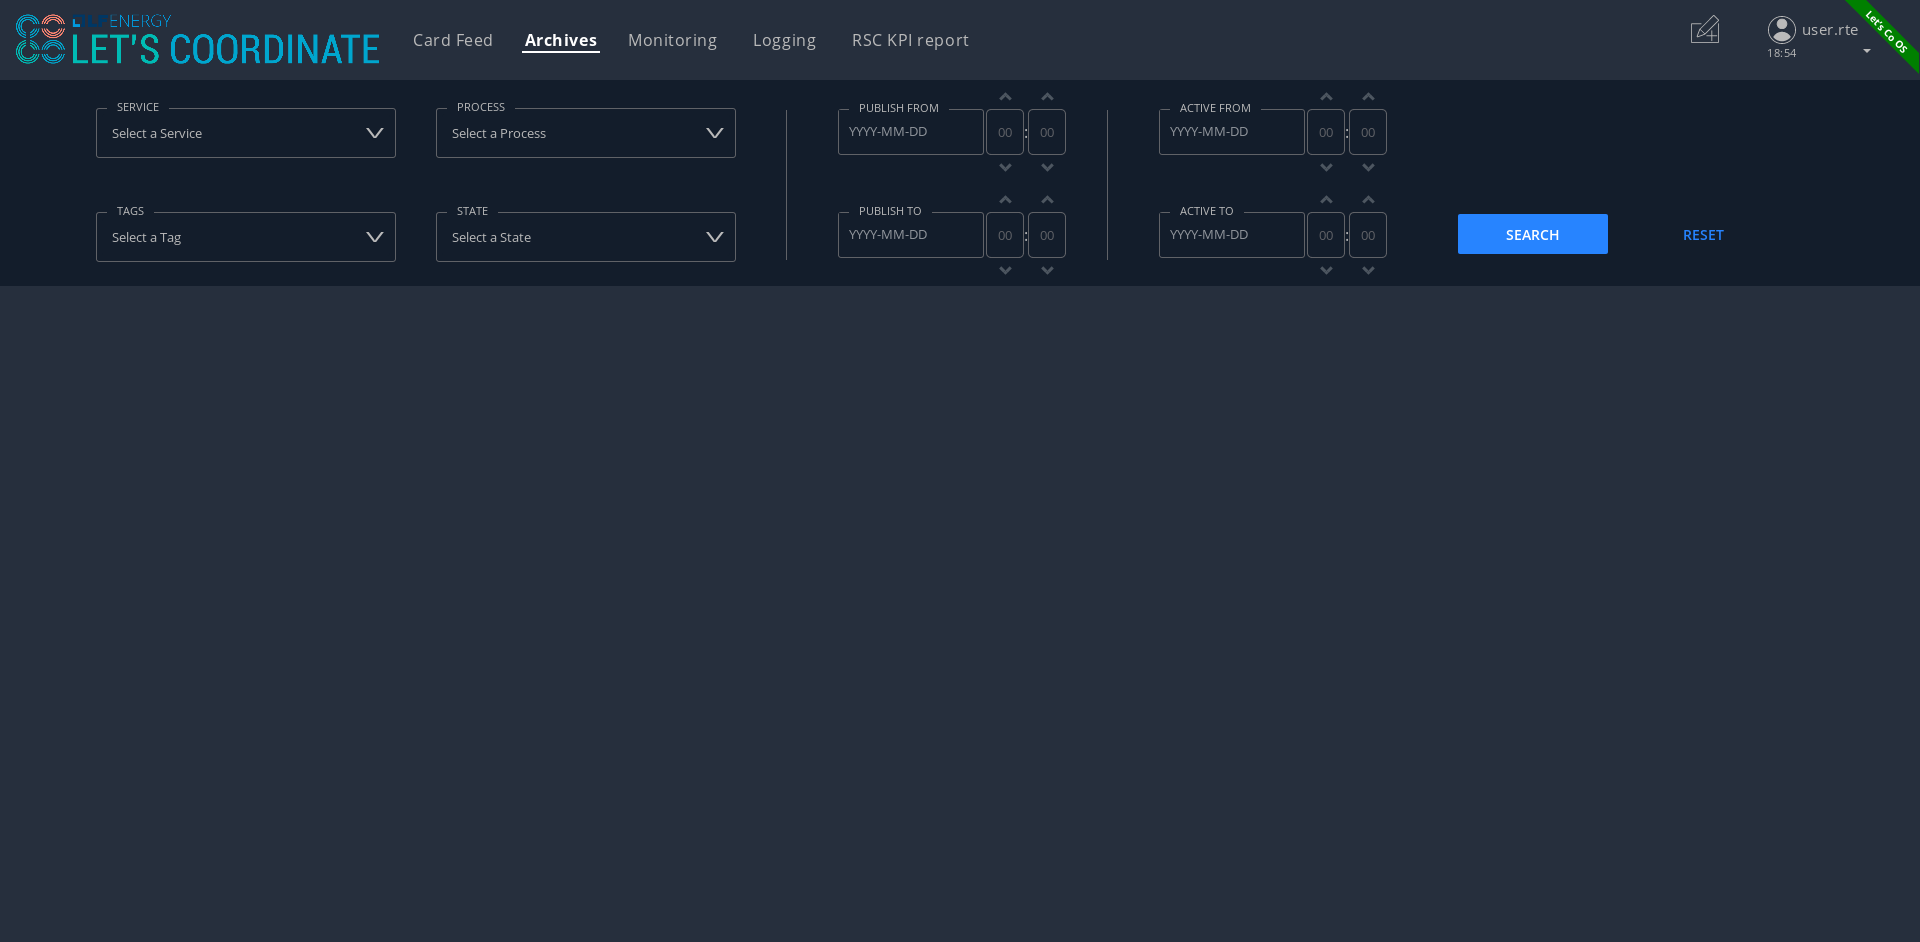
4.3. Archiving screen
This screen displays all past and current received notifications. User is able to search among all notifications available by using filters based on:
-
Service: name of RSC service (CGM, CSA, CCC, OPC, STA…)
-
Process: list of sub item under the selected service
-
State: status of the notification for selected service and process
-
Tags: types of notificationto search notification by keywords
-
RSC Process (CGM, CSA, CCC, OPC, STA…)
-
Kind of notification per process (CSA process success, CSA process failed…)
-
-
Published date & hour of the notification: publish from and publish to
-
Business period date & hour inside of the notification content: active from and active to
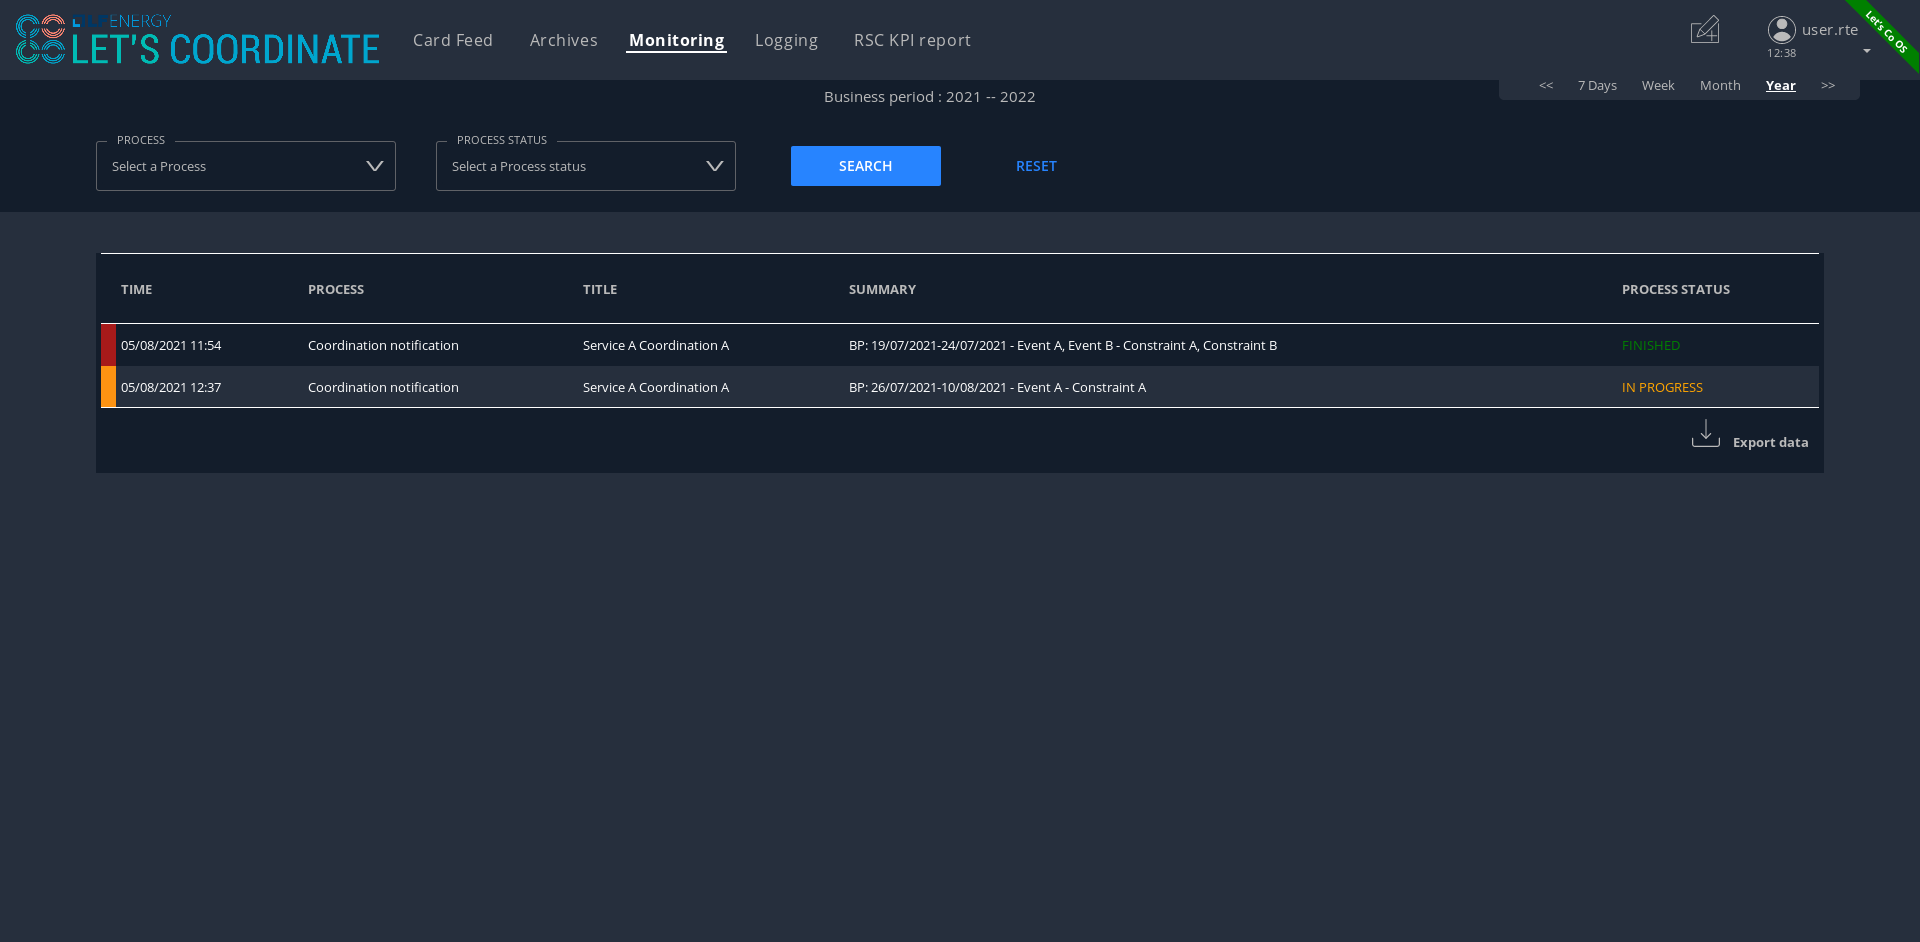
4.4. Monitoring screen
This screen allows each user (TSO and RSC) to monitor the status of coordination.
2 views are proposed for this screen
-
General view : main information about the coordination’s status in live
-
by selecting the right coordination from the table, the user can open the detailed view
-
It is possible to export the coordinations' information as xlsx file
-
-
Detailed view : details from the selected coordination cases with display of the different answers of each TSO (updated in live if coordination process is still running)

4.5. Logging screen
This screen displays logs of the relevant information about the coordination process:
-
New request for coordination/validation
-
Reception of answers from TSOs to this coordination/validation
-
Final result notification
-
Reception of input file to describe the expected coordination/validation
-
Sending of output file with results of this coordination/validation
It is possible to export the logs as xlsx file

4.6. RSC KPI report screen
This screen displays the relevant Key Performance Indicators (KPIs) for business processes.
It’s composed of two parts:
-
Configuration RSC KPI report screen: This screen proposes settings to configure the report user want to see. When the settings are set, then click on “Submit” button to display the report. User can choose:
-
Which RSC service?
-
List of RSC service registered is proposed
-
-
Granularity / Period:
-
Granularity of the information: Daily or Yearly
-
Period: select the business period
-
When granularity is Daily: from start day to end day
-
When granularity is Yearly: from start year to end year
-
-
-
Which area (RSC or Region/CCR) is concerned?
-
User should decide to see the information per RSC or per Region/CCR but not together.
-
If granularity is Daily: user should select or “Pan-EU”ropean to see the global value of this KPI or one of the RSC or one of the Regions/CCRs.If granularity is Yearly: user can select multiple choices in the same category:
-
Pan Eu from RSC part + 1 or multiple RSC
-
or Pan-Eu from Regions/CCRs + 1 or multiple regions/CCRs
-
-
-
Which kind of KPIs?
-
Global performance (Pan European KPI which are not linked for any RSC or Region/CCR) and/or Business (KPI relevant for the concerned area: RSC or regions)?
-
-

-
RSC KPI display screen: In this screen all graphs about KPI based on user configuration will be displayed. For every graph, user can add a comment below the graph itself. User has the possibility to export the graphs with comments as a pdf report by clicking on the pdf icon or export data (data only without graphs) as an Excel report by clicking on the Excel icon at the bottom. In case of pdf export, comments will be displayed.

5. Tool functionalities
5.1. Notification management
Notification reception
A notification appears in the card deck and displays a bubble in the timeline (depending on type of card)

Open a notification
User can click on a notification in the deck to open the detailed content

It’s also possible to see the dedicated notification in a larger/full screen with this button: 
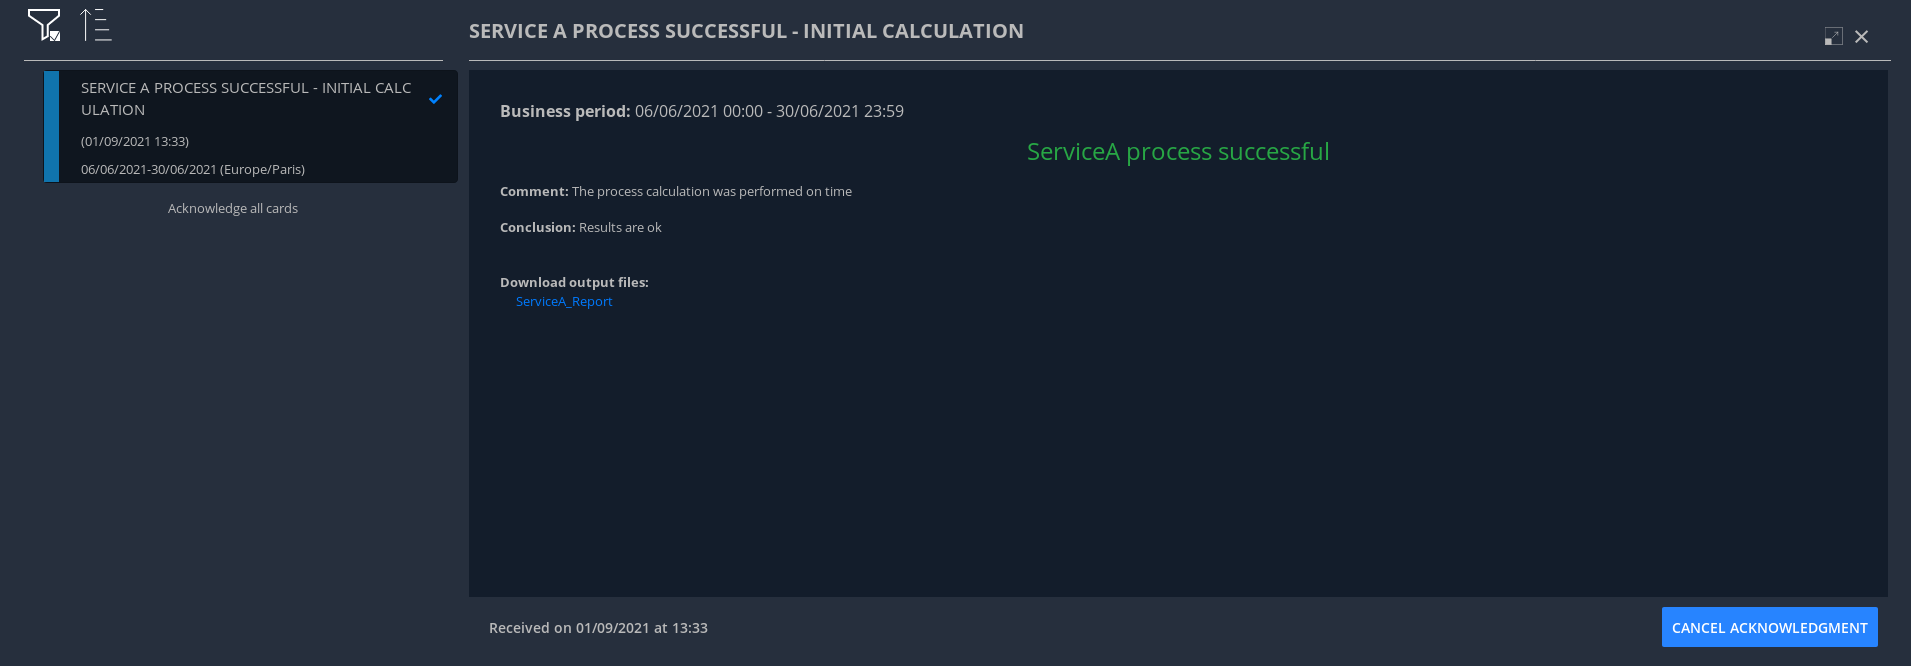
Acknowledge a notification
With action buttons present in detailed view, user can act on the card (acknowledge it if card type is information or accept/refuse it if card type is action).
Ex: For informative notification, user is able to acknowledge the notification to keep track of its reading. After a performed acknowledgement, notification will disappear from the deck. The only way to see it again is to consult the Archiving screen or to update the default filter which only shows the “not acknowledged” notifications.
5.2. RSC KPI graphs and report
Set RSC KPI graphs
The user chooses the RSC service, the data granularity (daily or yearly), the period (starting and ending dates), the RSC or Region, and the KPI data type (Global performance and/or Business process):
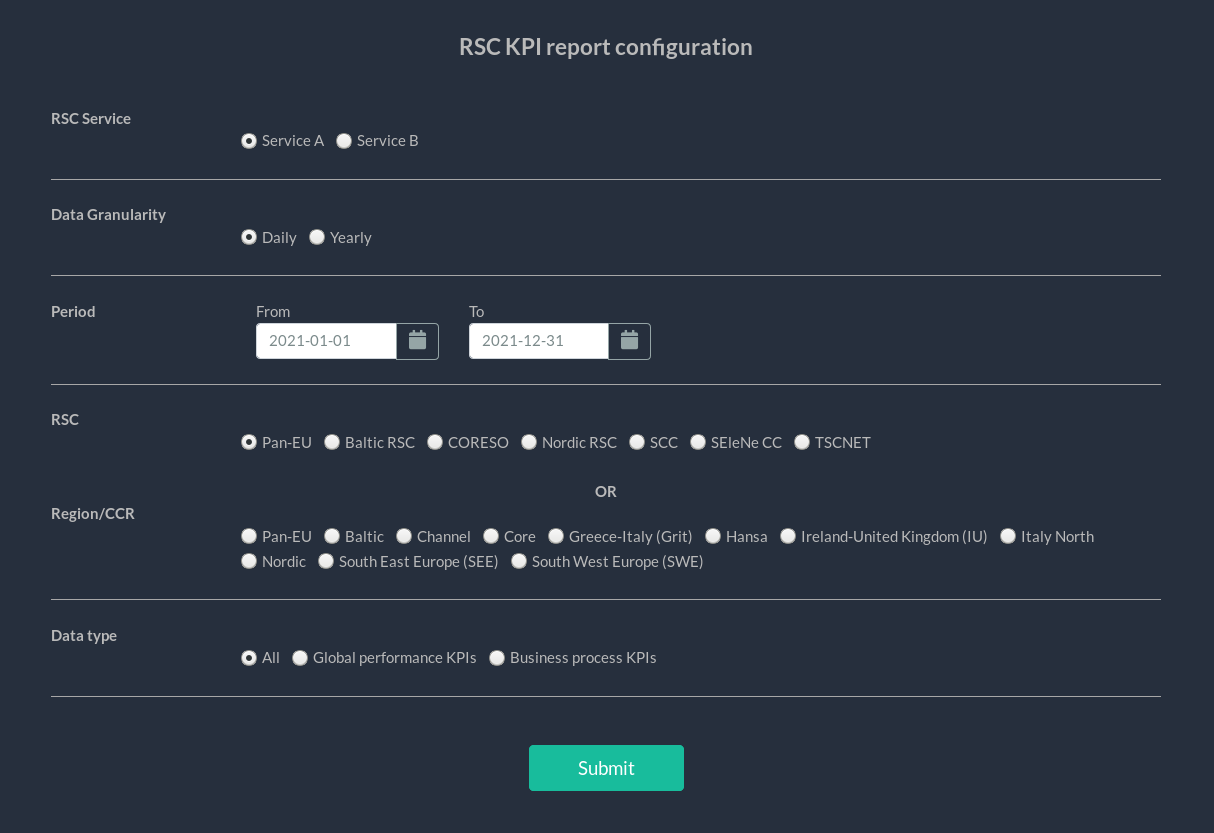
Selection of RSC service selection
This selection allows to choose which RSC services KPIs should be displayed:
-
CGM,
-
CSA,
-
CCC,
-
OPC,
-
STA,
-
etc…
Only 1 service can be selected
Data Granularity selection
User should select the granularity of data. This to see the data with a daily granularity (one value per day if existing) or yearly (one value per year if existing).
Period selection
User selects the period from 1 day to 5 years.
When data granularity is daily, we recommend to not use more than 1 year period.
election of area: RSC or Region
This selection will filter data for the concerned area: for one RSC or one Region/CCR, or general in case of Pan-EU (Pan-European).
-
If granularity is Daily: user should select
-
or “Pan-Eu”ropean to see the global value of this KPI
-
or one of the RSC (not possible to select multiple RSC together)
-
or one of the Regions/CCRs. (not possible to select multiple Regions/CCRs together)
-
-
If granularity is Yearly: user can select one or multiple choices in the same category:
-
RSC category ; “Pan Eu”, 1 or multiple RSCs together
-
or Region category: “Pan-Eu”, 1 or multiple Regions/CCRs together
-
Data type selection
Figures depends on selected type of KPIs:
-
If global performances KPIs: no difference if user selects a RSC or all RSC, only global KPIs here,
-
If business KPIs: these KPIs are different for each RSC or each Region/CCR as data are correlated to TSOs under responsibility of each RSC or TSOs linked to each Region/CCR.
RSC KPI graphs in GUI
User can see dedicated RSC KPIs graphs in GUI and can add some comments below each graph.

Export KPI report
The user can export KPI in pdf format by clicking on the dedicated button (pdf report will contain the comments if provided by user). It can also download report in xlsx to export only the values (no graphs).

RSC KPI report - pdf sample:
RSC KPI report - xlsx sample:
5.3. Reception notifications configuration screen
Reception of the notifications is configurable for each RSC service.
For each RSC process, a specific menu allows each user to determine which notification he wants to receive:
-
If the notification is ticked, then user will receive it,
-
If not, user will not receive it.
By confirming its choice with dedicated button, user will update its default settings. These settings will be applied directly in the feed screen.
5.4. Archiving system
User has the possibility to consult all received notifications in Archiving screen:
The screen is composed of 3 different components:
-
Research parameters
-
Found notifications list
-
Detailed view of notification
Research parameters
User can decide to set up some filters or not and see dedicated cards by clicking on search button
Different available filters are:
-
Service = user can select the RSC service
-
Process = user can select process related to selected RSC service
-
State = user can select state for the selected process
-
Tags = user can enter a keyword
-
Published date & hour:
-
publish from = all notifications published from this date/hour
-
publish to = all notifications published before this date/hour
-
-
Business period date & hour: active from and active to
-
active from = all notifications where business period is active at least in one hour from this date/hour
-
active to = all notifications where business period is active at least in one hour from this date/hour
-
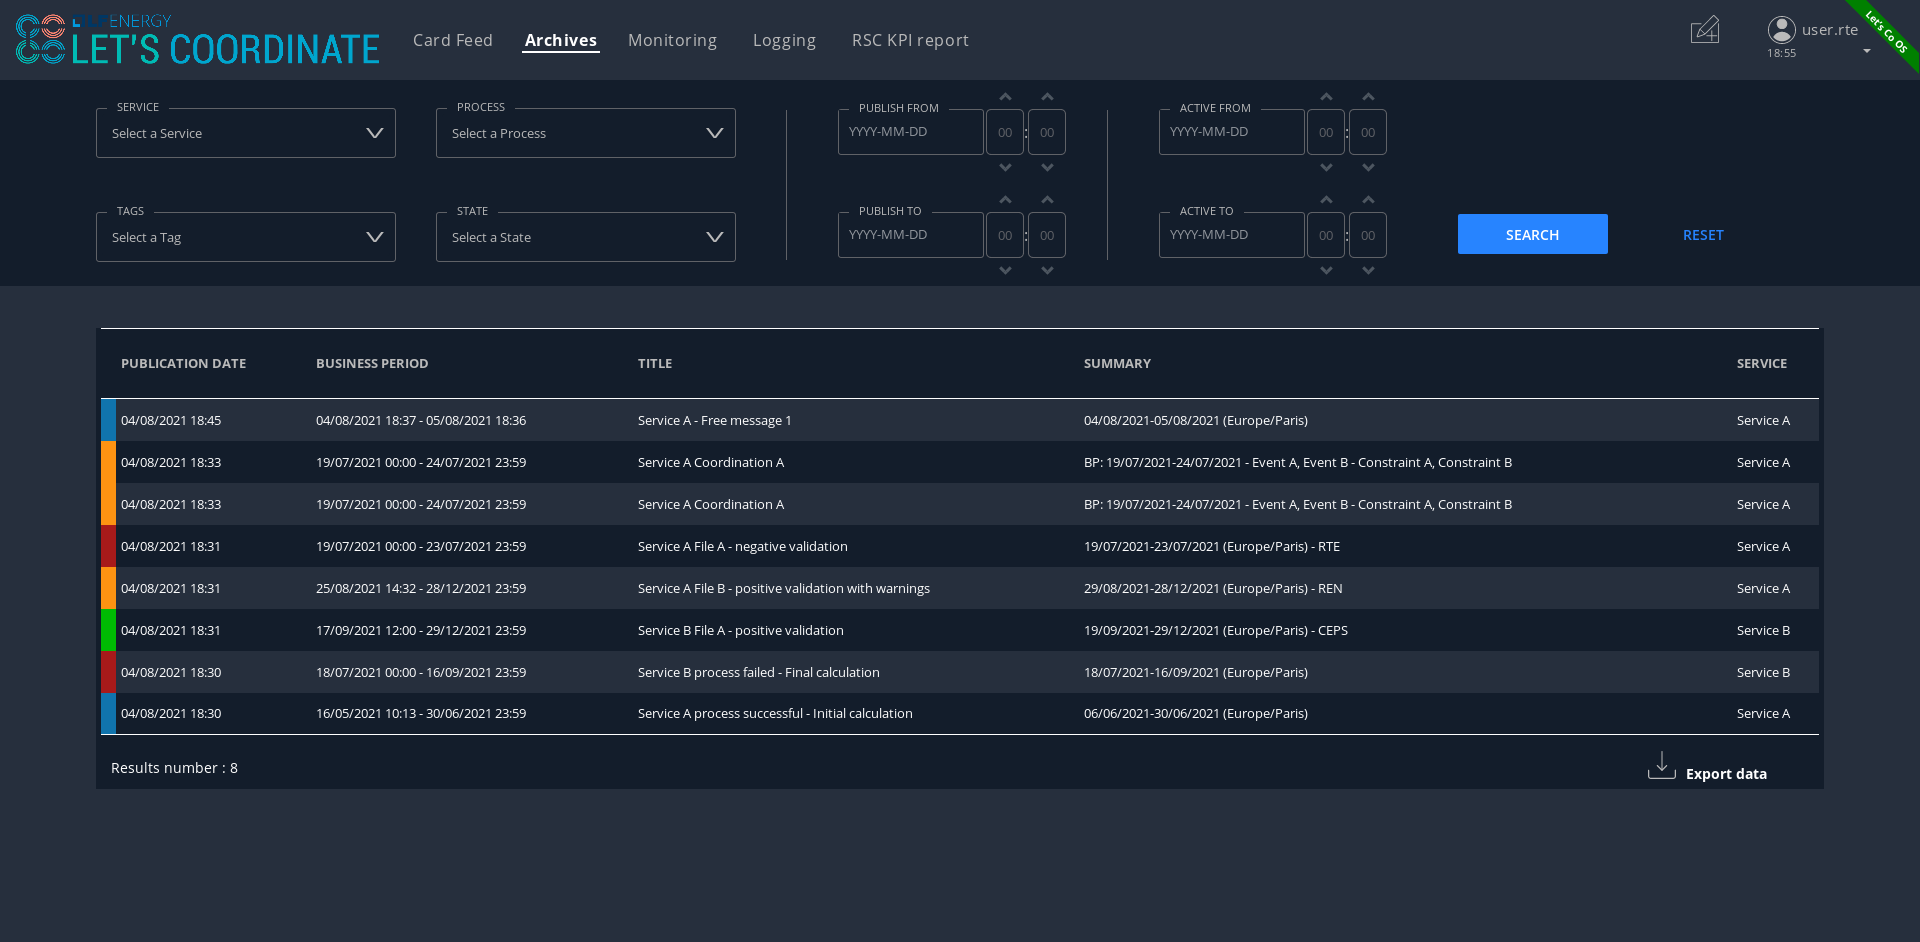
Found list of notification
List of notification found in the database will appears as a list. In case of multiple pages, user can change from one page to another one with dedicated buttons.
Detailed view of notification
User can open a notification in detailed view to consult them more in details by clicking on it.
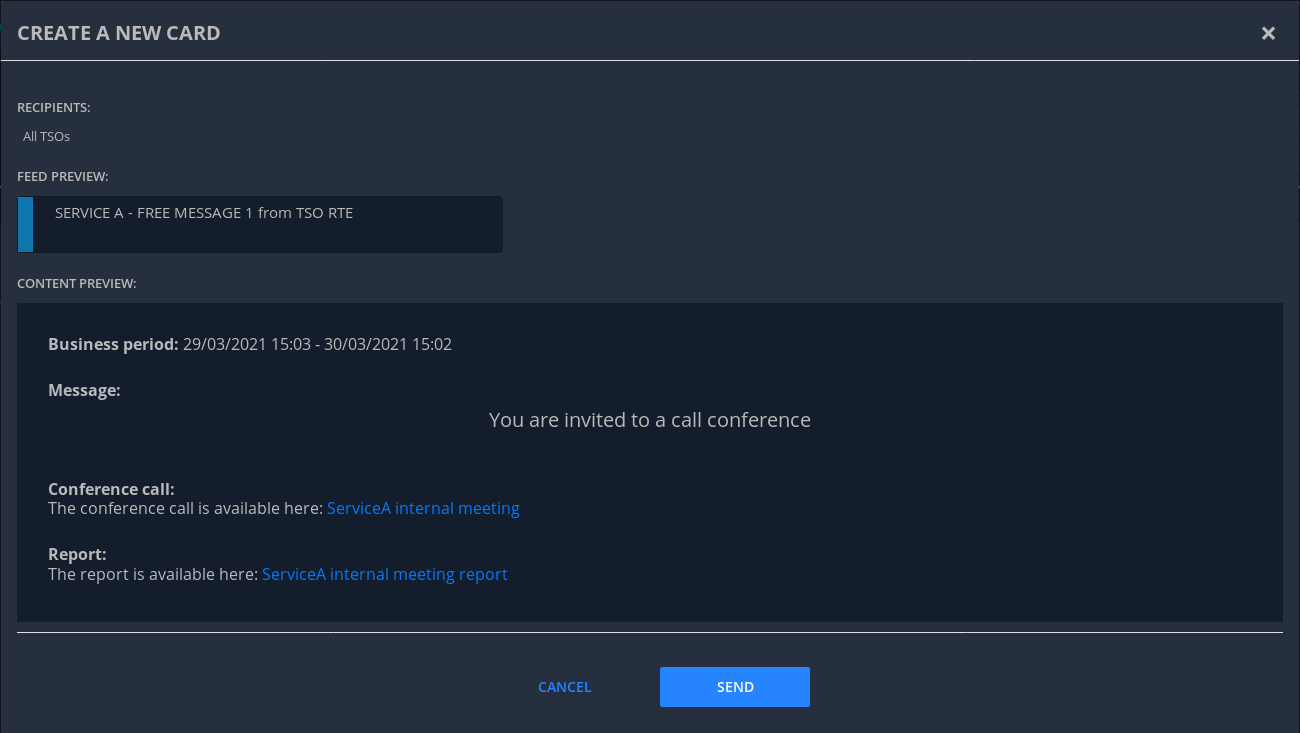
5.5. Notification creation
The goal of this screen is to create a notification from Let’s Coordinate GUI and to send this notification to other users.
A specific button on the top right is dedicated to open the card creation screen

5.5.1. Settings view
When clicking the card creation button, the following screen is opened:
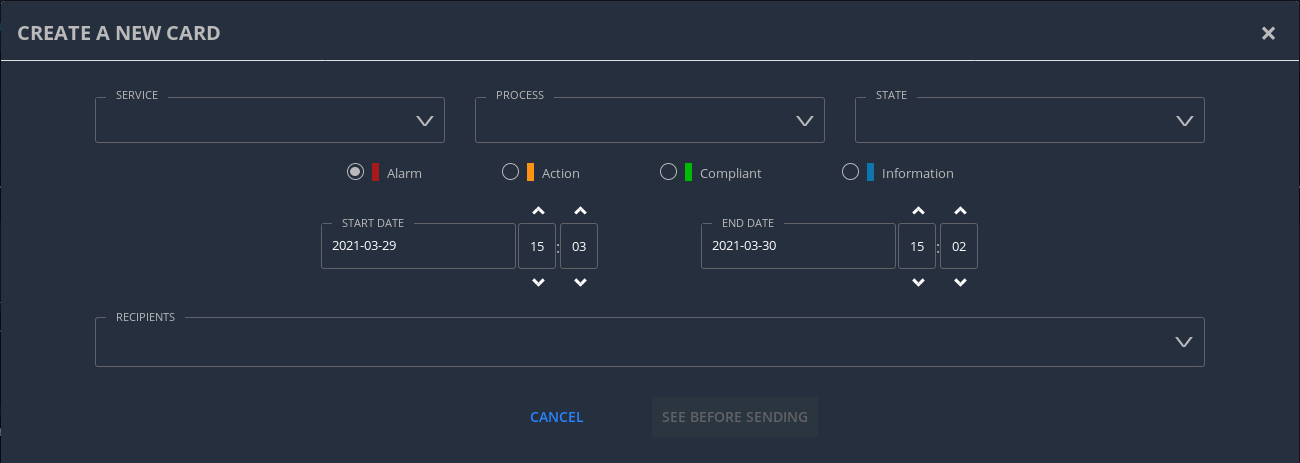
In this screen, the user is invited to select/fill the required fields:
-
Service: the list of RSC services (CSA, CCC, …)
-
Process: the list of process related to selected service
-
State: the list of state related to selected process
For each combination of Service/Process/State, the displayed fields will be different and are customizable.
But some fields are mandatory:
-
Severity: Allow the changing of the card’s color according to the severity of the card (Alarm, Action, compliant, information).
-
Start date: The notification’s business start date
-
End date: The notification’s business end date. By default the end date value is the start date +24h.
-
Recipients: The list of users (TSOs and/or RSCs) or/and group of users (all users, per TSO, per RSC, per CCR/region, per RSC, all TSOs, all RSCs) for whom the notification will be sent. If no recipient chosen, the notification will be sent only to the user who created it.
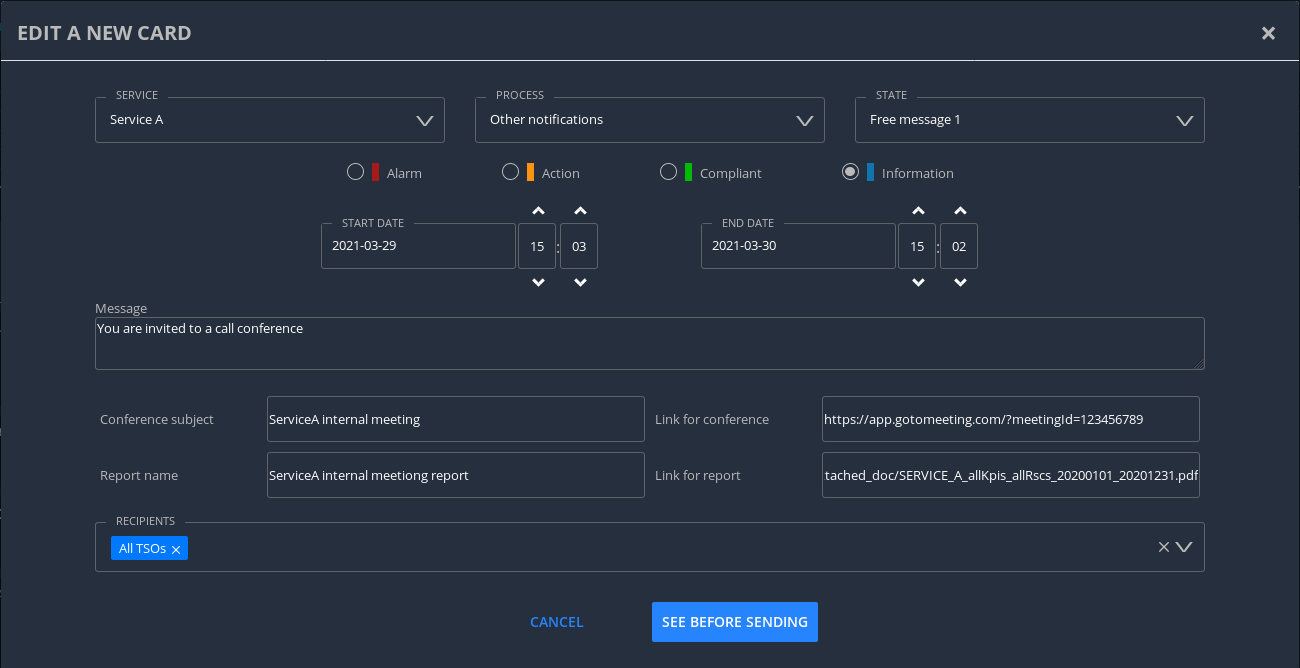
-
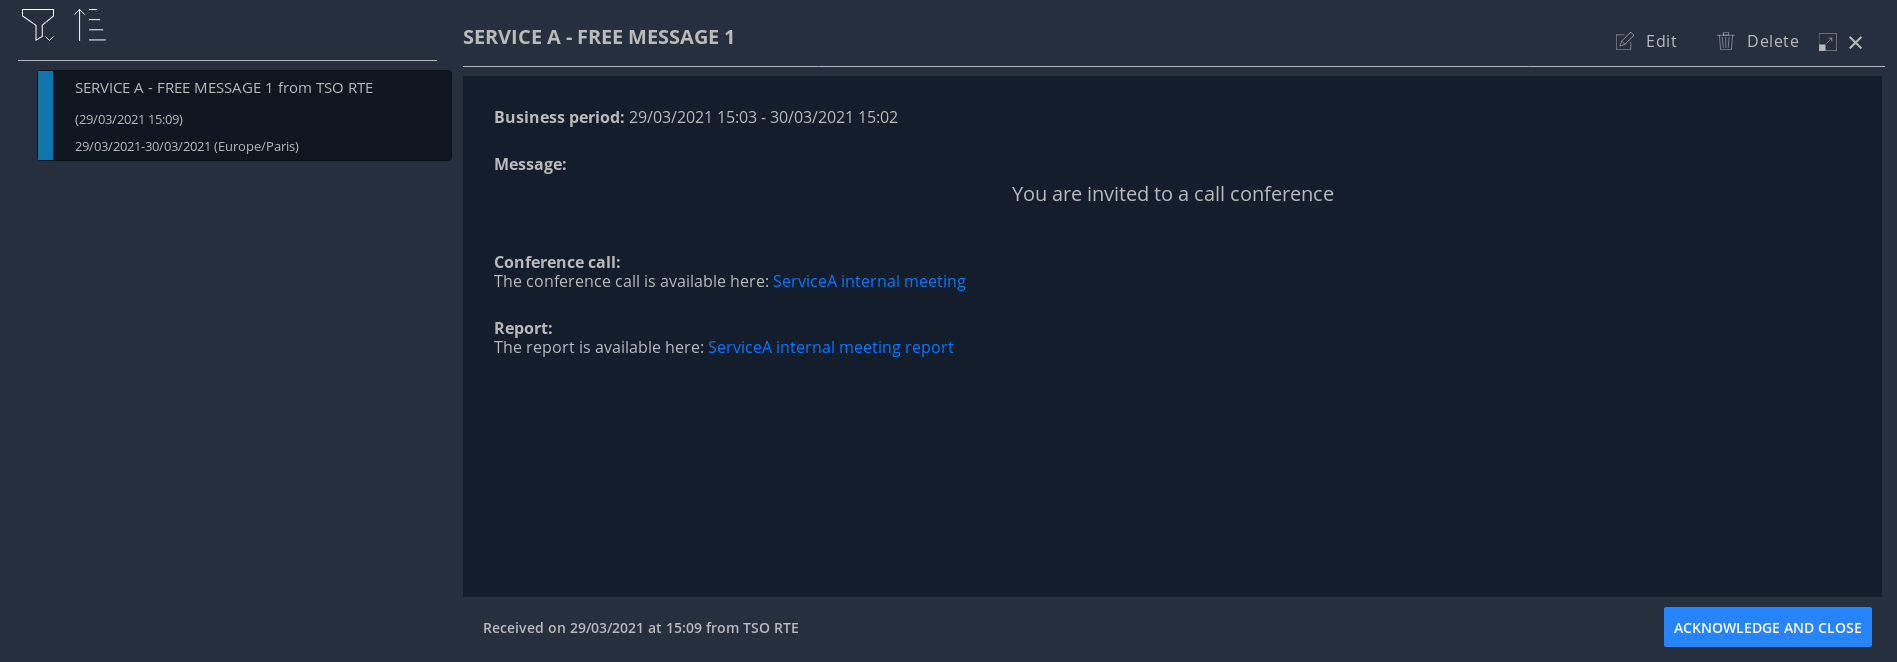
Message: The text message of thise notification to send to other users (TSOs or/and RSCs)
-
Conference subject: The subject of the conference. When this field is filled, the "Link of conference" field will be required.
-
Link of conference: The url address/link of the conference. When this field is filled, the "Conference subject" field will be required.
-
Report name: The name of the report. When this field is filled, the "Link of report" field will be required.
-
Link of report: The url address/link of the report. When this field is filled, the "Report name" field will be required.
6. Existing generic notifications
6.1. Informative notifications
Depending on the business process, notifications will be different and adapted to each business process.
6 generic notifications are identified:
-
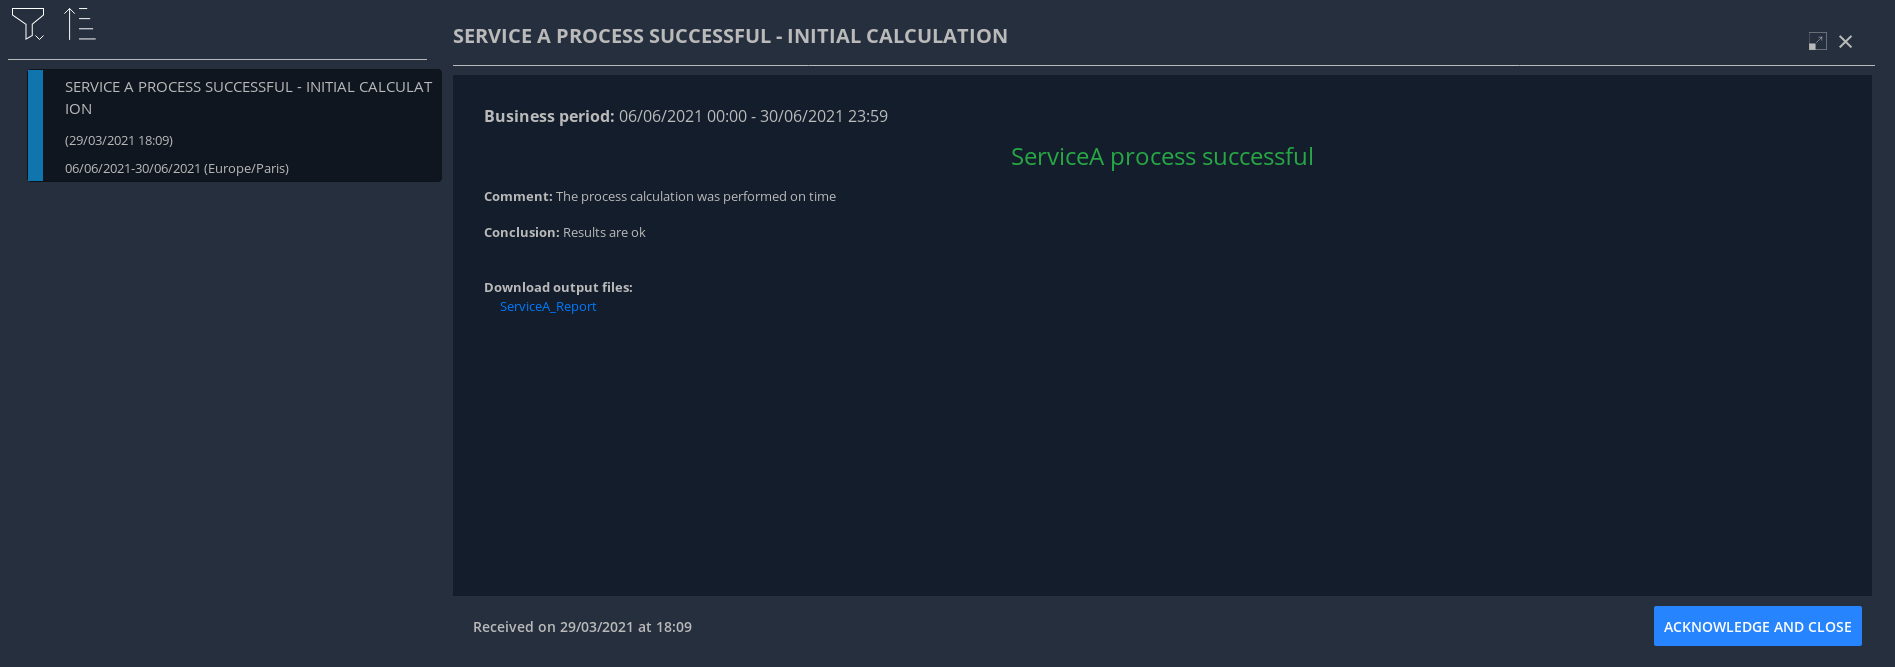
Process success: This notification is emitted as soon as a process finished a step of the RSC process which was successful. This notification can present some files as process results to be downloaded. Color = BLUE.
-
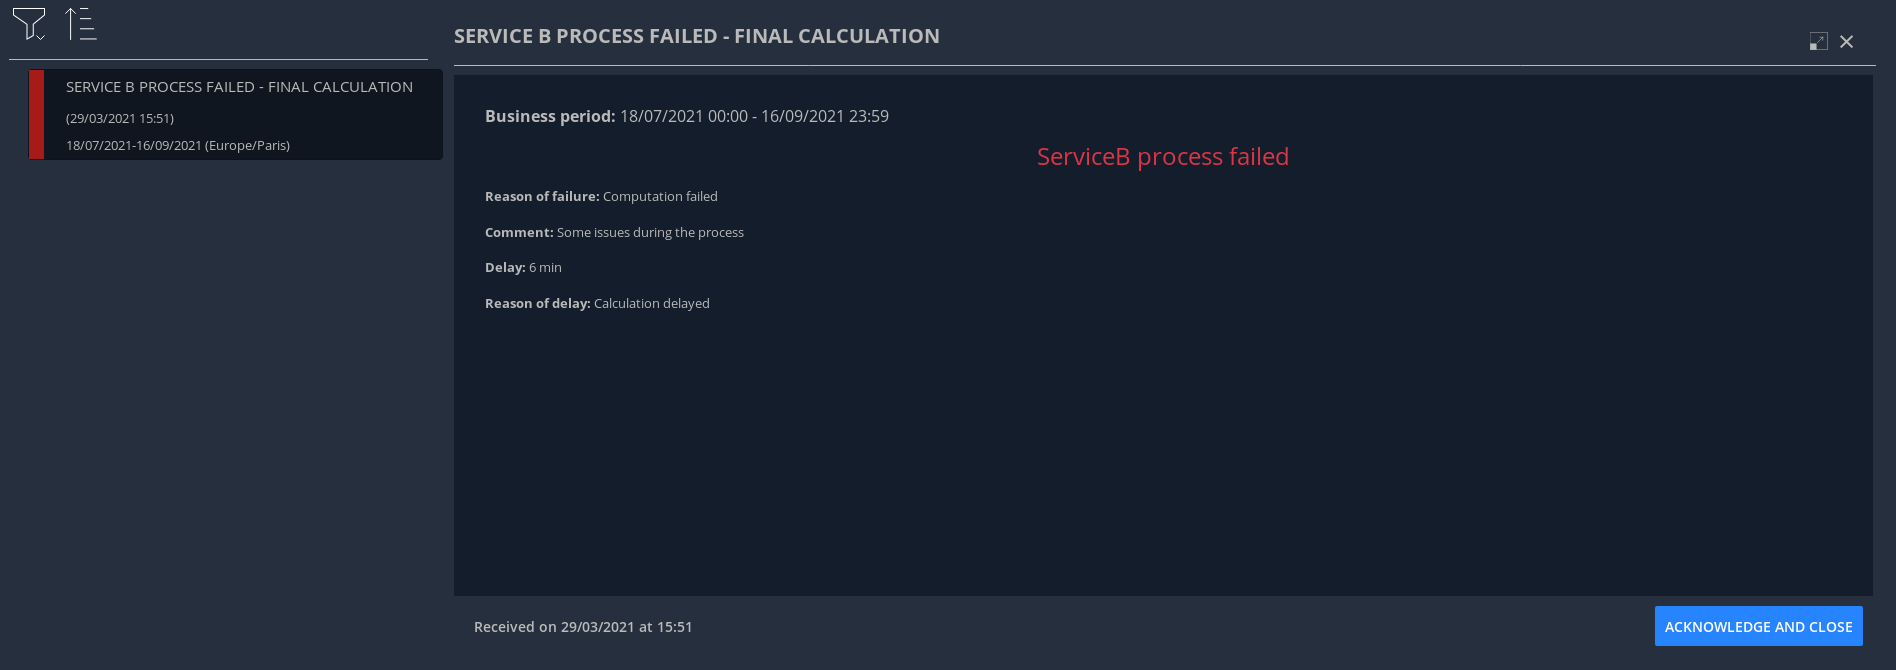
Process failed: This notification is emitted as soon as a process finished a step of the process wich was not successful or failed to finish the process step. This notification can present some files as process failure information to be downloaded. Color = RED.
-
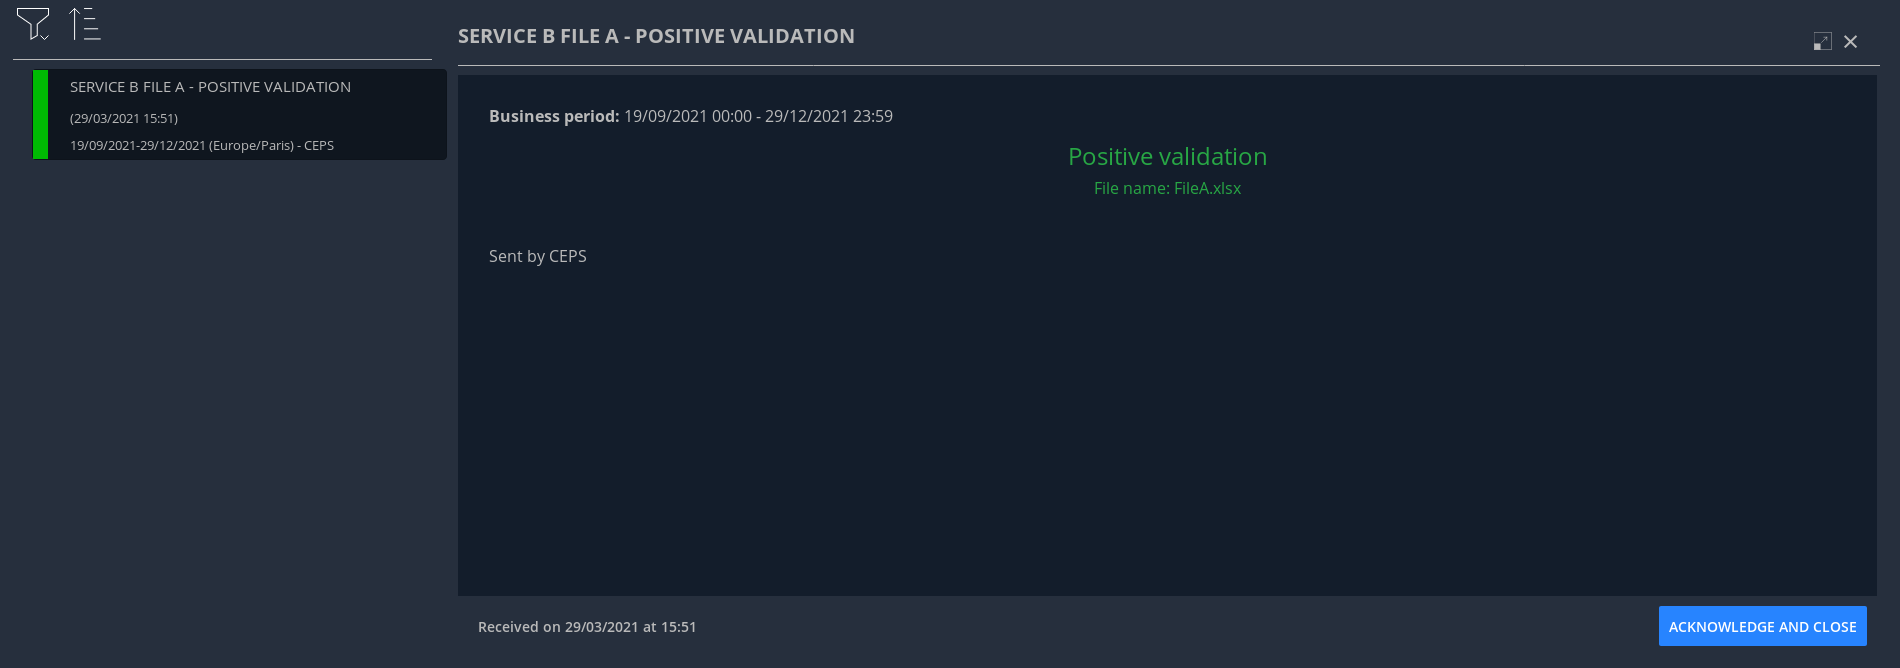
Validation of input file: This notification is emitted as soon as a validation of an input file has been performed by a business RSC/TSO tool and a dedicated ACK has been generated. There are 3 possible results:
-
Positive validation: in case the input file is correct. Color = GREEN
-
Positive validation with warnings: in case the input file is correct but has some warnings. Color = ORANGE
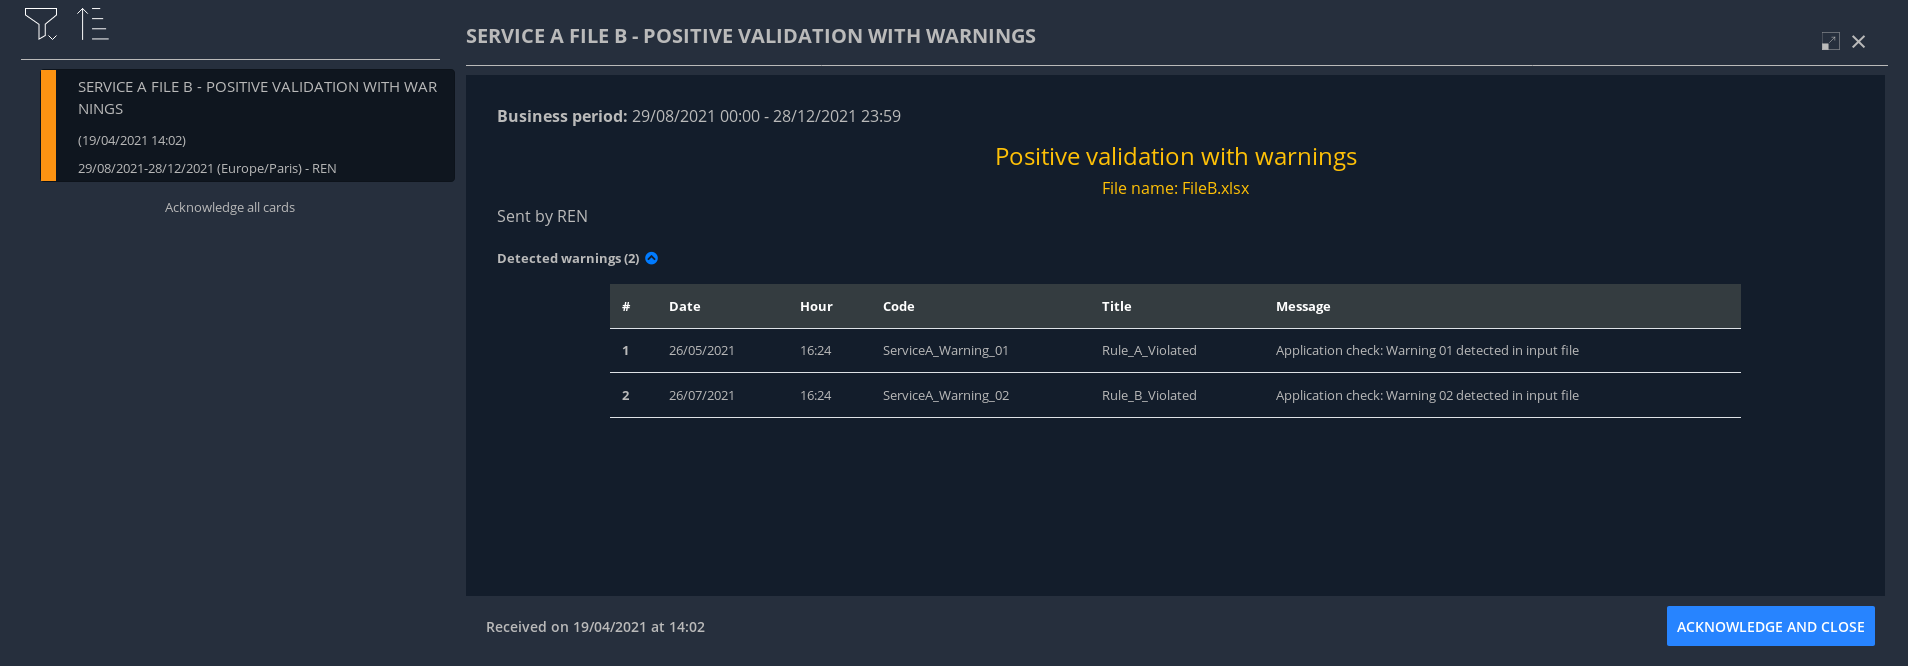
-
Negative validation: in case the input file failed the validation as detected errors. Color = RED
-
-
User created notification: in case a user create a notification from the GUI
6.2. Smart notifications
-
Coordination Notifications:
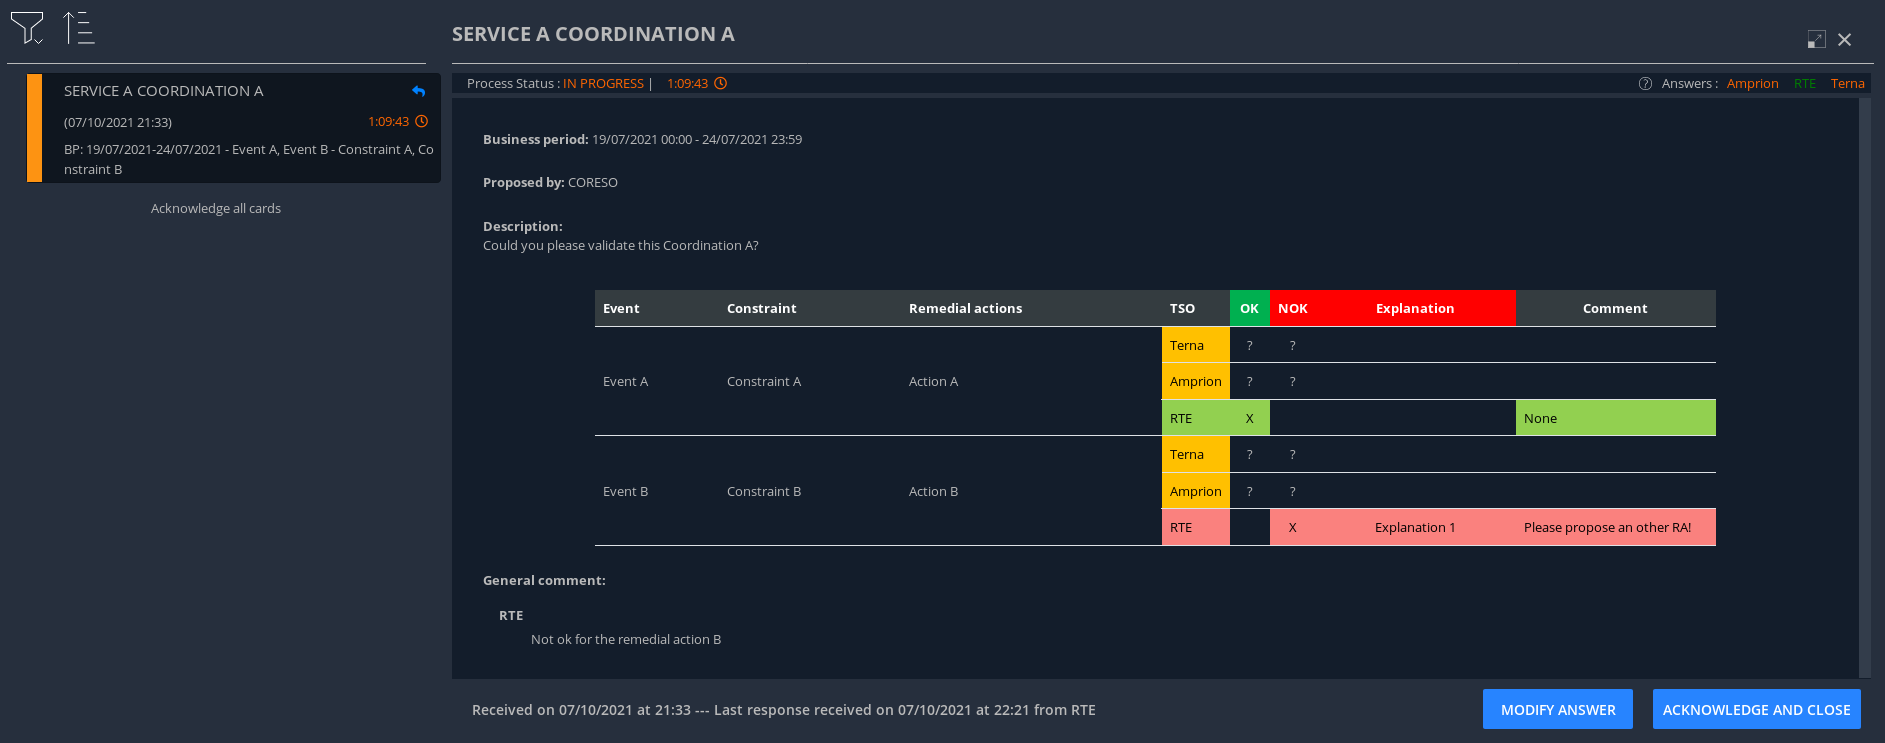
For some processes, different TSOs will have to give their advice about a common question asked to different TSOs. This behavior is considered as a Coordination function.
In different steps :
-
QUESTION: Smart notification is issued to ask TSOs to answer to one or multiple questions. Color = ORANGE

-
Each time a TSO answers then the orange notification is updated with his response.

-
End of coordination QUESTION: 2 cases:
-
End because all TSOs participating in this coordination provided their answers to the question.
-
End because of LTTD (Last Time To Decide) reached: a coordination can stop when the deadline (LTTD) is reached.
-
-
RESULTS of COORDINATION : When coordination QUESTION is ended, an INFORMATIVE notification is issued automatically to present the results of the coordination : 2 cases:
-
All answers provided are “Validated”, then the notification is green

-
At least 2 answers are different, then the notification is red.

-